Apple’s valuation soars to record levels
Investors’ appetite for Apple seemingly has no limit. With the share price climbing parabolically and up 20.3% this month alone, the market capitalisation surpassed $2tn. Apple and its cohorts are lifting the S&P 500 index and widening the gap between these tech mega caps and the rest of the market. While historical performance and fundamentals say nothing about the company’s future prospects, they can provide context, and pause for thought on what future returns are likely to be.
Valuation over time
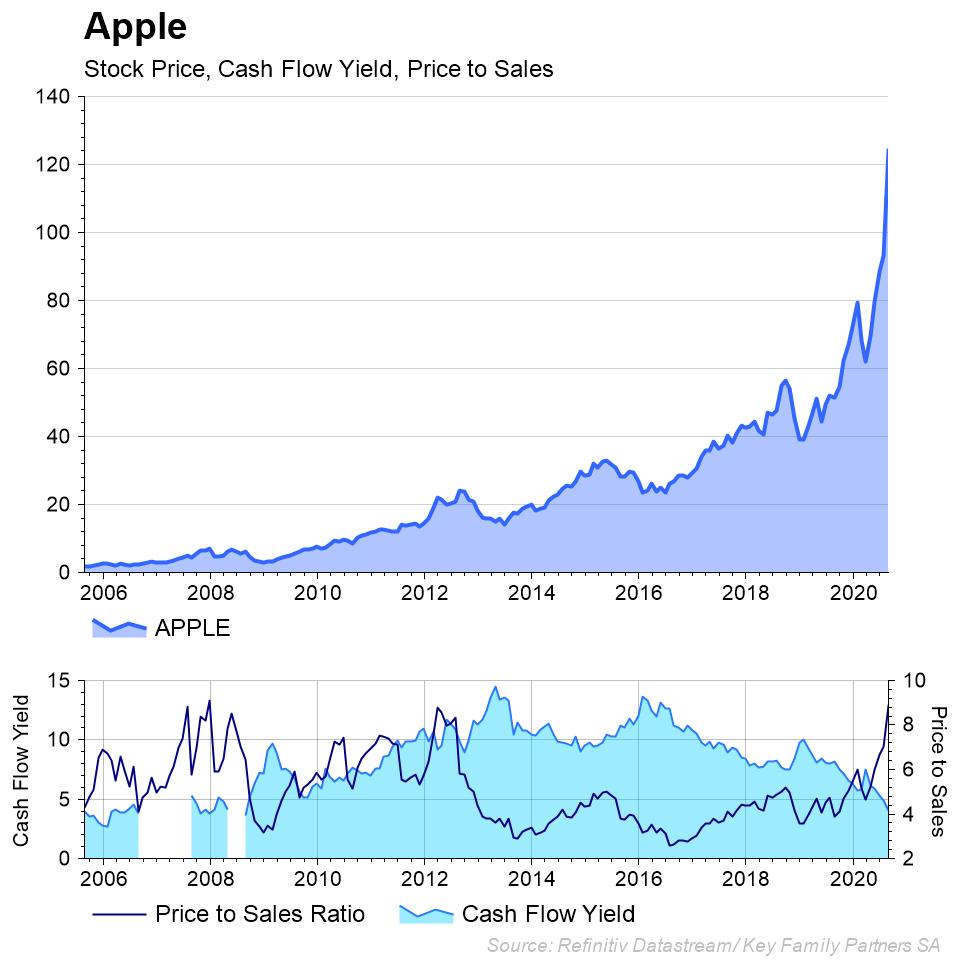
The chart shows Apples remarkable price rise, with two fundamental measures in the pane below. The first, a measure of return to the stockholder relative to its price (the 12 month Forward Cash Flow Yield), and second, a valuation measure (the Price to Sales). We prefer these measures to similar ones based on earnings, because they remove non-cash items and give a cleaner picture of the relationship between money into the business and the share price. Charting through time considers where it stands today relative to its history which, like all things, are cyclical. Studying the chart we can notice:
- Valuation: the Price to Sales ratio (dark blue line, right scale) shows Apple trades at 9.2 times Sales. This is as expensive as it was in 2007, and 2012, and significant price declines shortly followed.
- Cashflow Yield: its Cash Flow is shown as a yield (light blue area, left scale). This is a measure of the company’s return per unit invested in the stock. The yield today is 4%, the lowest since before the Great Financial Crisis. It’s logical, since interest rates have plummeted earning 4% seems ‘OK’ to some investors when cash or bonds are at 0.70%. It’s also a lot of price risk to take for a declining returns, in my opinion.
Apple is now trading at historical extremes, and there is enough history to draw some conclusions about what this means for investors. The Cash Flow yield shows us that investors today are receiving 4%, which says nothing about earnings growth*, but it’s nonetheless approaching the all-time minimums on the chart. Converse to this is valuation, and the last time Price to Sales was this high was in 2013 when Apple fell peak-to-trough -44.3%, and in 2008 peak-to-trough -59.30%**. But investors may not even care, considering that both 2008 and 2013 saw the stock recover within 18 months.
Investor optimism
– Phillip Fisher
“The stock market is filled with individuals who know the price of everything, but the value of nothing.”
I’m aware that this quote could be applied both ways, as the bulls will argue that value investors don’t appreciate the true future value of Apple. Perhaps Apple will continue to rise over the medium term, driven by ever above average long-term growth or, quite possbly, if US interest rate expectations turn negative. The key, for us at least, is not to chase such a rise for Fear Of Missing Out, but appreciate what our investors’ are getting in return for what they are paying, and potentially risking.
* In fact, the market implied return, at these levels, is closer to 24% earnings growth per annum for the next five years. This is extremely optimistic for a company this size. By constrast, a lower figure of 7% for five years, would value the shares some 60% below today’s price.
** Apple saw an -82.50% decline between 2000-2003, although this pre-dates the chart.

Key Family Partners SA is a multi-family office based in Geneva, Switzerland. We serve our members with investment services, financial planning, administration, succession planning, education and philanthropy. Contact us at KFP@keyfamilypartners.com ~ +41 22 339 00 00 ~ Rue François-Bonivard 6, 1201 Geneva. https://www.keyfamilypartners.com/
This article has been prepared by Key Family Partners SA (“KFP”) solely for information purposes and subject to any error or omission; it is not an investment recommendation nor amounts to investment, legal or tax advice or an offer or solicitation to purchase or sell any financial instrument.
